The Great Housing Reset marches on, especially in superstar cities and prominent tech hubs.
Now, a recent report from the real estate website Trulia provides substantial evidence of this Great Reset from owning to renting. The report examines growth in renting versus owning across the U.S., as well as the rise in rental housing prices and the growing housing burdens faced by renters between 2006 (two years prior to the economic crisis) and 2014. To get at this, the report uses data from the American Community Survey for 50 of the largest U.S. metros. My MPI colleague Charlotta Mellander then went back to ACS and extracted data on the share of households that are renters versus owners and ran a correlation analysis of the key economic, demographic, and social factors that bear on them.
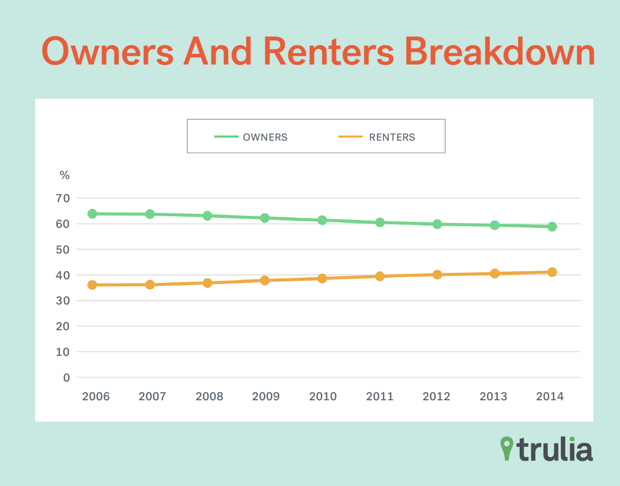
As the chart above shows, the share of U.S. households that rent increased from 36.1 percent in 2006 to 41.1 percent in 2014. Meanwhile, the share of households who own their own homes declined over that same period. The share of renters increased in each and every one of the 50 U.S. metros Trulia examined.
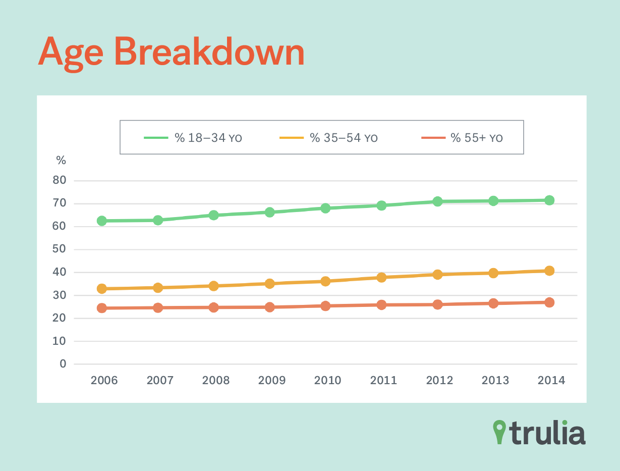
The increase in renting was most notable among millennials. The share of renters between the ages of 18 and 34 jumped from 62.5 percent in 2006 to 71.6 percent in 2014. This increase in renting was even larger among Americans between the ages of 26 and 34, rising by a whopping 10.9 percentage points between 2006 to 2014, compared to 5.9 percentage points for the younger group. As the report notes:
Traditionally, young adults have become first-time homebuyers as they grow older and have [advanced] in their careers and incomes. This suggests that the fundamental shifts in the economy (job loss, low-income growth, diminishing affordability of homes) may have caused the increase in renting for those in the 18-34 year-old group.
But renting was up among all age groups, as the chart above shows. The share of renters increased from 33 to 40.7 percent among households ages 35-54. Trulia speculates that this group may have been hard hit by job loss and foreclosure during the crisis. Renting also increased, from 24.4 to 27 percent, among Americans aged 55 and older.
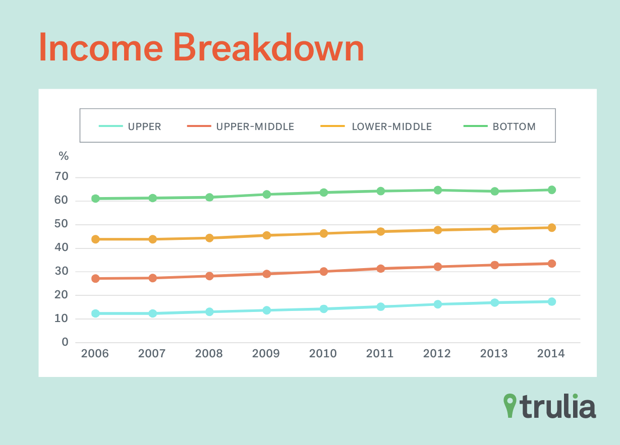
The shift from homeownership to renting was actually more pronounced among middle-class and more affluent Americans, according to the report. Among the lowest income households, those making $31,000 or less, the share of renters grew by 3.7 percentage points, from 61.1 to 64.8 percent. For lower middle-class Americans (households earning between $31,000 and $42,000), the share of renters increased by 4.9 percentage points, from 43.8 to 48.7 percent.
A much larger share of black and Hispanic American households were renters over this time period. As of 2014, 66.1 percent of Hispanics and 61 percent of African Americans were renters, compared to just 34.4 percent of whites. While all racial groups saw a shift from owning to renting between 2006 and 2014, Hispanics experienced the largest rise—an 8.7 percentage point increase (from 57.4 to 66.1 percent)—compared to a 5 percentage point increase (from 56 to 61 percent) among black households and a similar increase (from 29.5 to 34.4 percent) among white households.
The transition overall is led by large, dense, superstar cities like New York and L.A., as well as knowledge and tech hubs like Boston, Seattle, Austin, and San Francisco and Silicon Valley in the Bay Area, among others. These metros have some of the largest shares of renters compared to homeowners. In fact, there are three metros where more than half of households rent: New York, L.A., and San Francisco.
| Top Ten Metros | Largest Share of Renters |
| New York, NY | 56.9% |
| Los Angeles, CA | 54.4% |
| San Francisco, CA | 53.7% |
| Las Vegas, NV | 49.4% |
| San Diego, CA | 47.7% |
| Miami, FL | 47.2% |
| San Jose, CA | 43.7% |
| Oakland, CA | 43.2% |
| Austin, TX | 42.9% |
| Orange County, CA | 42.5% |
| Bottom Ten Metros | Smallest Share of Renters |
| Long Island, NY | 20.5% |
| Warren, MI | 27.8% |
| Minneapolis-St. Paul, MN | 30.0% |
| Pittsburgh, PA | 30.9% |
| St. Louis, MO | 31.3% |
| West Palm Beach, FL | 32.6% |
| Hartford, CT | 33.3% |
| Buffalo, NY | 33.5% |
| Baltimore, MD | 34.6% |
| Cincinnati, OH | 34.9% |
The knowledge and tech hubs of San Diego, San Jose, Oakland, Austin, Boston, and Seattle all rank among the top 15 U.S. metros with the largest share of renters. A number of service- and tourism-based metros like Las Vegas and Miami also rank high up the list. It’s no small coincidence that these places were obliterated by foreclosures during the financial crisis. On the flip side, older industrial metros such as Pittsburgh, Buffalo, St. Louis, Cincinnati, and Baltimore rank among the metros with the lowest shares of renters, with less than 35 percent.
The table below shows the ten large U.S. metros where rents grew the most compared to those where rents grew the least between 2006-2014. This time, knowledge and tech hubs like San Jose in the heart of Silicon Valley, Washington, D.C., Seattle, San Francisco, Denver, Austin, and Portland, Oregon, top the list. New York, San Antonio, and Charlotte round out the top ten.
Metros with the Largest and Smallest Rent Increases, 2006-2014
| Top Ten Metros | Largest Increase in Rent |
| San Jose, CA | 42.6% |
| Washington, D.C. | 38.9% |
| Seattle, WA | 38.3% |
| San Francisco, CA | 33.7% |
| Denver, CO | 32.0% |
| Austin, TX | 31.8% |
| Portland, OR | 31.8% |
| New York, NY | 31.3% |
| San Antonio, TX | 29.2% |
| Charlotte, NC | 28.8% |
| Bottom Ten Metros | Smallest Increase in Rent |
| Las Vegas, NV | 3.8% |
| Detroit, MI | 6.4% |
| West Palm Beach, FL | 7.2% |
| Providence, RI | 10.1% |
| Orlando, FL | 11.4% |
| Sacramento, CA | 11.9% |
| Cleveland, OH | 12.3% |
| Riverside-San Bernardino, CA | 14.9% |
| Atlanta, GA | 15.8% |
| Cincinnati, OH | 15.9% |
At the end of the day, housing affordability is made up of two things: the cost of rent and the income and wages people use to pay for it. In the aftermath of the economic crisis, renters have been caught in a devastating bind as rents have risen while incomes decline. Average rents increased by 22.3 percent between 2006 to 2014, while average incomes declined by 5.8 percent.
Increasing rent burdens hit hardest at Hispanic households, where rent burdens grew from 32.1 to 35.1 percent, compared to smaller increases for black households (from 33 to 34.6 percent) and white households (from 28.3 to 29.1 percent).
Rent burdens also vary across metros. Renters in 40 out of 50 U.S. metros were spending a greater portion of their income on rent in 2014 than they were in 2006. The table below looks at the metros with the highest and lowest percentage of their income spent on rent for 2014.
Metros with the Highest and Lowest Shares of Income Spent on Rent, 2014
| Top Ten Metros | Highest Share of Income Spent on Rent |
| Miami, FL | 39.9% |
| Detroit, MI | 35.4% |
| Los Angeles, CA | 35.3% |
| Fort Lauderdale, FL | 35.2% |
| Riverside-San Bernardino, CA | 35.1% |
| West Palm Beach, FL | 34.3% |
| Long Island, NY | 34.0% |
| Orange County, CA | 33.9% |
| Orlando, FL | 32.8% |
| Sacramento, CA | 32.6% |
| Bottom Ten Metros | Lowest Share of Income Spent on Rent |
| Pittsburgh, PA | 26.2% |
| San Francisco, CA | 27.3% |
| Minneapolis-St. Paul, MN | 27.8% |
| Warren, MI | 27.8% |
| Columbus, OH | 28.1% |
| Seattle, WA | 28.2% |
| Houston, TX | 28.2% |
| Charlotte, NC | 28.2% |
| Cincinnati, OH | 28.3% |
| San Antonio, TX | 28.5% |
Here we see an interesting pattern. Aside from L.A., the places with the highest rent burdens are Sunbelt tourist and service-oriented metros like Miami and Orlando or hard-hit Rustbelt metros like Detroit, where incomes are already low.
In a previous analysis, Mellander and I found that housing burdens in tech hubs fell disproportionately on service and blue collar workers, while knowledge and creative class workers made more than enough to cover housing.
All of this shapes an uncomfortable pattern where rents are higher in leading superstar cities and tech hubs like San Jose and Seattle, but rent burdens—or rent as a portion of one’s overall income—are worse in tourist, resort, and service metros like Miami, West Palm Beach, and Las Vegas, as well as hard-hit Rustbelt metros like Detroit.
Homeownership is no longer the key driver of America’s industrial economy. Across the U.S., cities and metros with higher rates of homeownership have had more trouble adjusting to the demands of the knowledge economy, trapping their residents in housing they cannot sell and limiting their ability to adjust to economic downturns. Meanwhile, cities and metros with more renters have proven better able to cope with the transformation from an industrial to a knowledge economy.
In fact, metros with greater shares of renters have higher wages, higher productivity (measured as economic output per capita), and greater concentrations of high-tech firms, according to Mellander’s basic correlation analysis. Metros with greater shares of renters also have higher concentrations of highly educated adults with college degrees and a greater share of the workforce made up of creative class workers in science and technology, knowledge-based professions, and arts, culture, entertainment, and media. Metros with greater shares of renters are also substantially denser and more diverse—two other factors that contribute to innovation, creativity, and economic growth.
In other words, Great Resets do not occur all at once, but gradually over many decades. While suburbia fit the needs of the old industrial economy by stoking demand for products coming out of its factories and industrial assembly lines, that system ultimately became dysfunctional, contributing directly to the crisis. The current Great Reset from owning to renting is occurring not only because many people prefer urban-style living, but because more flexible rental housing in denser areas is more in sync with the knowledge economy.
The most innovative, productive, and flexible metros have roughly 50 to 55 percent of households who rent. Over the course of the Reset, I predict that the share of renters is likely to increase nationwide to around 45 percent, as the share of homeowners declines to perhaps 55 percent.
All of this begs for a change in America’s housing policies. Currently, many policies incentivize homeownership and the construction of wasteful, energy inefficient, sprawling suburbs in addition to conferring large subsidies on relatively wealthier homeowners. In the future, they should become more neutral with regard to multifamily rentals versus single-family homeownership, while conferring subsidies on low-income renters who bear the largest housing cost burdens.


