BY: JANN SWANSON
Two US Census Bureau researchers have determined that the biggest determinants of household wealth are owning a home and having a retirement account. While that may not be surprising, the degrees of magnitude are.
Using data from the 2015 Survey of Income and Program Participation, Jonathan Eggleston, an economist, and Donald Hays, a survey statistician in the Bureau’s Social, Economic and Housing Statistics Division found that the wealth inequality between homeowners and renters is striking, with the former having median net worth 80 times that of the latter. Further, they found wide variations in wealth across demographic and socioeconomic groups. Given that the two are using 2015 data and with the rapid increase in home values since then, the degree of inequality today is probably greater.
The authors say net worth is an important indicator of economic well-being that provides insights into a household’s economic health. For example, during financial hardships such as illness or unemployment wealth is a buffer. It is measured by the value of assets owned minus the debts owned. Therefore, net worth can be negative. Households in the top 1 percent of net worth were excluded from the study.
About half of households had outstanding unsecured debt with a median of $7,500. Credit card and store bills were the most common unsecured liability and about one in five households had outstanding student loan debt, with a median for those that did of $20,000.

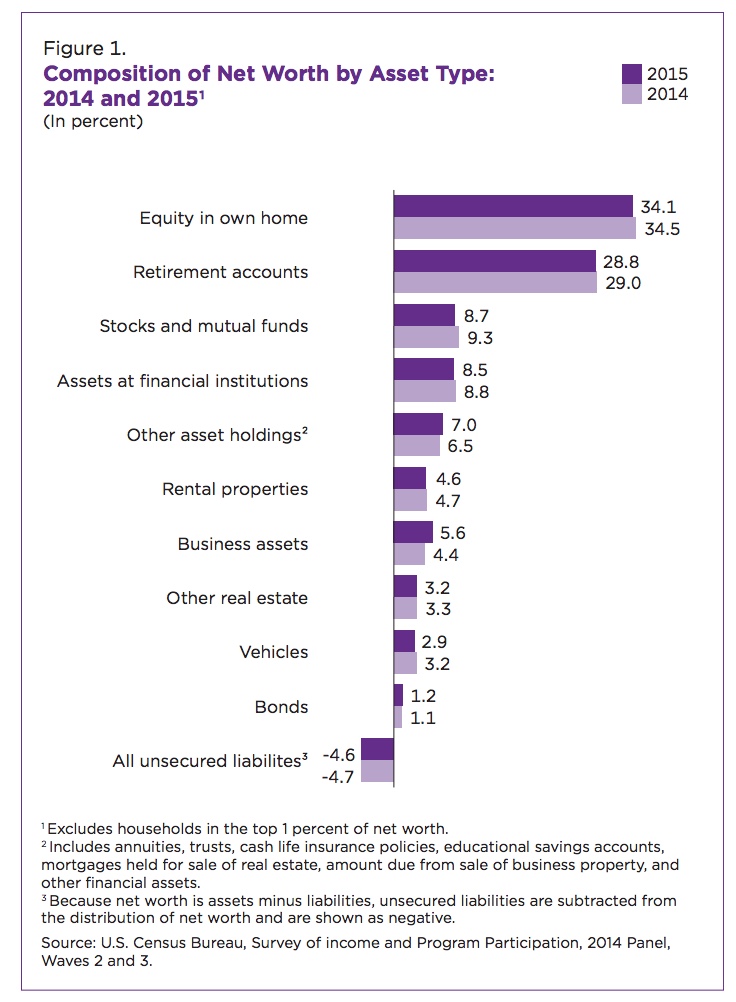
In 2015, 37 percent of households did not own a home and 47.1 percent did not have a retirement account. For those who had both, the home equity and savings accounted for 62.9 percent of the household’s net worth. Equity provided 34.1 percent and retirement accounts made up 28.8 percent
From there, the percentage of assets contributing to wealth drops off sharply. The third and fourth categories, stocks/mutual funds and bank accounts made up about 8.5 percent each. Some of the most commonly held assets made up only a small portion of wealth, for example, 91 percent of households hold those fourth-ranked bank accounts while the largest contributor to wealth, home ownership was the third most commonly held asset. While the median amount of home equity was $95,800, the median value of assets at financial institutions was $4,600.
There were significant differences in worth within categories of age, gender, race, education, and employment. Having health insurance also appears to be a factor although it would be a result rather than a cause.
Unmarried female householders between the ages of 35 and 54 had a median wealth of $14,860. That was 39.5 percent of the median wealth held by unmarried males of the same age. That difference, however, disappeared in the 55- to 64-year old group; both unmarried women and their male counterparts had grown their net worth to about $60,000.
Non-Hispanic white and Asian householders had more household wealth by far than black and Hispanic householders. Non-Hispanic whites had a median household wealth of $139,300 and Asians $156,300 compared with $12,780 for black and $19,990 for Hispanic householders.
Households in which the most educated member held a bachelor’s degree had a median wealth of $163,700, compared with $38,900 for households where the most educated member had a high school diploma.
Not surprisingly, those households in which at least one person had a full-time job for the entire year had a higher net worth ($101,000) than those where all members had a part-time job ($61,690) or were unemployed ($22,100). Households in which people were without health insurance all or part of the year had dramatically lower median wealth: $16,860, compared with $114,000 for households in which all members had health insurance for the entire year.
Credits: Jann Swanson | MORTGAGE News Daily